Gantt chart
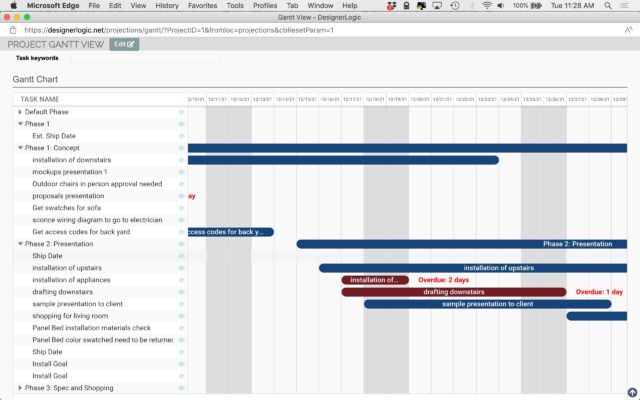
A Gantt chart is a powerful tool for visualizing events on a timeline, enabling team members to see at a glance the duration of each task, simultaneous activities, and key milestones.
Gantt charts make it easier to identify potential scheduling conflicts, monitor progress, and adjust plans as needed.
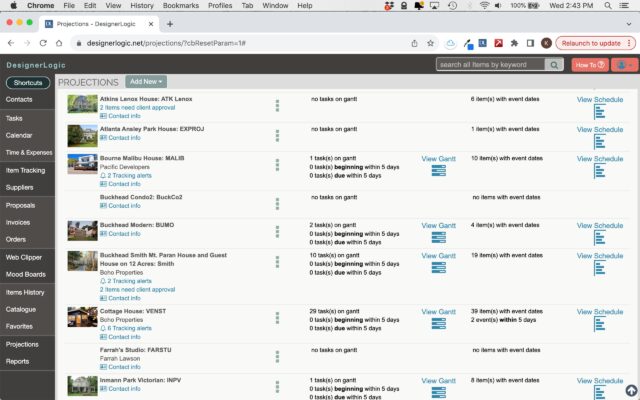
- Tasks with begin and end dates show up on the Gantt chart
- A project can have multiple phases (phase 1, phase 2, etc.), each with their own Gantt chart
- Tracking dates automatically show on Gantt charts
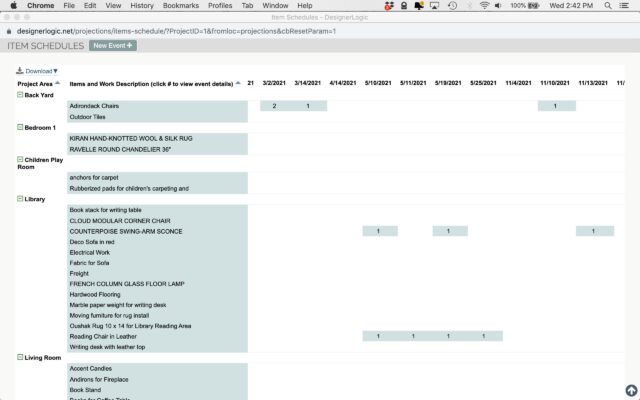
- Item events, like installation dates, are shown on a projections timeline
Next feature
Client portal
Organize events, files, products, and proposals for your clients. Clients can approve and leave comments directly on content, with email alerts for all updates.

View our simple pricing model. DesignerLogic has no hidden fees or contracts.
Try our 30 Day Free Trial with no strings attached. If you still have questions, feel free to contact us and we’ll be happy to address them.


